Construction Equipment Maintenance & Fleet Statistics

Keeping construction equipment running is getting more expensive, more data-driven, and harder to staff.  These statistics help explain why maintenance planning, parts availability, and repair decisions deserve close attention. They also show where equipment owners can look for improvements: better service records, earlier parts identification, clearer repair priorities, and more useful machine data.

Every figure links to its original or closest-to-original source: government data, company filings, research firms, or the trade publication that ran the survey.
Machine Operating & Maintenance Costs

Heavy equipment maintenance affects far more than the shop budget. A machine waiting on parts can delay a crew, create an extra rental bill, and push work into the next phase of a project. Even when equipment keeps running, rising parts prices and service rates can make each operating hour more costly.

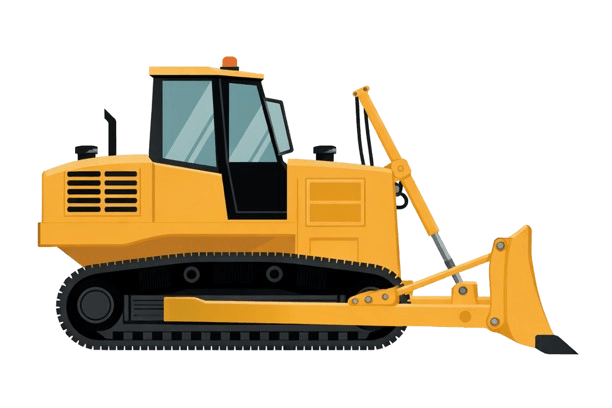
  • Caterpillar says undercarriage maintenance accounts for an average of 50% of dozer parts and service costs. (Caterpillar)
  • Caterpillar names too-tight track as the top cause of undercarriage-related dozer downtime. (Caterpillar)
  • Caterpillar estimates fuel makes up about 30% to 50% of total machine operating costs in quarry applications. (Caterpillar)
  • Komatsu telematics data from about 75,000 North American machines over 12 months showed an average idle time of 38%. Another manufacturer reported a 36-ton excavator idling about 40% of its roughly 1,000 annual hours. (Construction Equipment)
  • United Rentals reported $1.087 billion in repairs and maintenance expense for equipment rentals in 2025. (United Rentals FY2025 10-K)
  • Fullbay’s 2025–2026 State of Heavy-Duty Repair report puts the median shop labor rate at $149 per hour in 2025, up from $135 in 2024. Mobile service ran $160 per hour, compared with $145 for in-shop work. (FreightWaves)
  • In Fullbay’s 2024–2025 report, shops reported a 7.2% increase in the cost of mobile repair labor. (American Trucking Associations)

Fleet Maintenance Surveys

Across surveys, fleets report the same pressures: maintenance schedules slip, budgets rise, and the data needed to manage both is often missing or scattered.

  • Teletrac Navman’s 2025 Equipment Management report surveyed 736 equipment companies in the U.S., U.K., Australia and New Zealand. 47% struggled to keep to maintenance schedules, and 93% reported problems with operational efficiency and maintenance management. (Construction Equipment)
  • In Teletrac Navman’s 2024 telematics survey (TS24), 46% named equipment and vehicle maintenance as their top expense, up from 44% the year before. (Construction Equipment)
  • Teletrac Navman’s 2026 Equipment Utilization report used 600 responses collected in October 2025 across the U.S., U.K., Australia and New Zealand. 32% said maintenance frequently disrupts project timelines, and 27% often rent or buy extra equipment to cover downtime. (Teletrac Navman)
  • In Construction Equipment’s 2025 Fleet Outlook, 41.2% planned to increase maintenance spending in 2025. Only 15% did not use machine data to manage maintenance, and 64.1% managed machine data and maintenance in-house. (Construction Equipment)
  • In Construction Equipment’s 2026 Fleet Outlook, 19.9% said dealer support with machine data is a difficulty. Among fleets with replacement values above $10 million, 45.6% reported supply delays, compared with 28.6% of all fleets. (Construction Equipment)
  • In Construction Equipment’s 2022 outlook, 39% planned higher maintenance budgets to extend the life of existing machines, and 32% planned to increase in-house stock of key parts. (Construction Equipment)
  • In Equipment World’s 2026 Tech & Spec Survey, 83% of contractors perform at least small repairs and preventive maintenance in-house. (Equipment World)
  • In a 2017 Construction Equipment/CASE survey of fleets with $5 million+ replacement value, 61% said their fleets have telematics capability. (CASE/CNH)
  • A 2025 AlignOps/Construction Dive Studio survey found 97% of construction companies lack real-time visibility into their tools, materials and equipment. (Construction Dive)
  • In a 2026 Today’s Trucking reader survey of 322 respondents, nearly 70% said maintenance and repair costs rose significantly over the past two years, and 85% cited higher parts prices as a cost driver. (Truck News)

Who Does The Service Work?

Equipment owners still do most of their own service, but the share is slowly shifting to dealers and independent shops, especially for complex jobs like engine work. These figures come from MacKay & Company research, reported by Construction Equipment in October 2024.

  • End users performed 71% of their own service in 2023, down from 75% in 2016. (Construction Equipment)
  • 91% of end users change their own filters, but only 51% do internal engine work themselves. Equipment dealers perform 29% of engine work. (Construction Equipment)
  • Drivetrain and hydraulic system parts are the most-purchased aftermarket categories, at 19% and 16%. (Construction Equipment)
  • Users appear to limit outsourced service to about one hour of travel and about 40 miles. (Construction Equipment)

Market Size, Rentals, & Dealers

The equipment market is large but hard to size precisely. Owners are blending ownership with rental, and dealers are squeezed by rising equipment prices.

  • Estimates of the global construction equipment market vary widely by research firm. IMARC valued it at $258.5 billion in 2025, while Global Market Insights put it at $167 billion. (IMARC; GMI)
  • The world’s 50 largest construction equipment manufacturers earned a combined $246.6 billion in 2025, up 3.8% and the highest total the Yellow Table has recorded. (CEA, citing KHL’s Yellow Table 2026)
  • Aftermarket sizing varies even more than equipment sizing. One estimate puts the global construction equipment aftermarket at about $26.3 billion in 2024, with earthmoving and road-building equipment accounting for more than 45%. (Credence Research)
  • The American Rental Association expects U.S. construction, industrial and general tool rental revenue to grow 3.4% in 2026, to $83.5 billion. (RER)
  • United Rentals estimates its North American market share at about 15% as of December 31, 2025, or roughly 1 dollar in 7. (United Rentals FY2025 10-K)
  • EquipmentWatch’s 2026 Dealer Insights Report surveyed 398 verified North American dealerships in April 2026. 70% named rising equipment costs as their biggest economic disruptor. (EquipmentWatch)
  • EquipmentWatch’s 2025 State of the Construction Equipment Economy report surveyed 125+ contractors in July 2025. Among those who own equipment, 74% also rented in the past year, up from 71%. (Equipment World)
  • Used heavy-duty construction equipment inventory fell 2.56% month over month and 10.45% year over year in August 2026. (Sandhills Global, via Equipment FA)

Economy, Safety, & Policy

Softening backlogs, project delays, safety and theft risks, and right-to-repair rules all shape how fleets plan equipment spending and service.

  • ABC’s Construction Backlog Indicator fell to 8.0 months in January 2026, a four-year low. (BD+C)
  • In AGC’s 2026 Workforce Survey, 55% of firms had at least one non-data-center project canceled, postponed or scaled back in the previous six months. (AGC)
  • Construction accounts for nearly 1 in 5 U.S. work-related deaths. (CDC/NIOSH)
  • Heavy equipment theft in the U.S. is estimated at $300 million to $1 billion per year. (National Equipment Register)
  • Colorado passed the first U.S. agricultural right-to-repair law in April 2023. The FTC sued Deere over its repair restrictions in January 2025. The FTC and Deere reached a settlement in July 2026. (Colorado House Democrats; KCRG)

Final Thoughts About The Equipment Maintenance Stats

The numbers point one way: keeping machines running costs more each year, and fleets are holding equipment longer to manage it. Shop labor rates rose to a $149-per-hour median in 2025, and over 40% of fleets planned bigger maintenance budgets.

Most owners still service their own equipment, but they are short on technicians and lean on dealers for complex work. Most fleets now use machine data to manage maintenance, but fragmented data still leaves gaps in visibility.

The most efficient gains are in the basics: track tension and undercarriage care, idle time, and scheduled maintenance that actually happens on schedule. Fleets that pair those habits with usable machine data are best placed as costs, backlogs and policy keep shifting.